Highway Charts
The highway view enables the user to view data in graph form. This page can be customized to show only the desired data, hiding any tables that are not necessary at the time of use. All data is graphed against highway kilometre. For instance, it is possible to view the PCI/BCI rating for all kilometres of the highway. Furthermore, the graphs can also be customized to segment data by a number of kilometres, or to view data during a particular period (i.e. 6 months, 1 year, 2 years, etc).
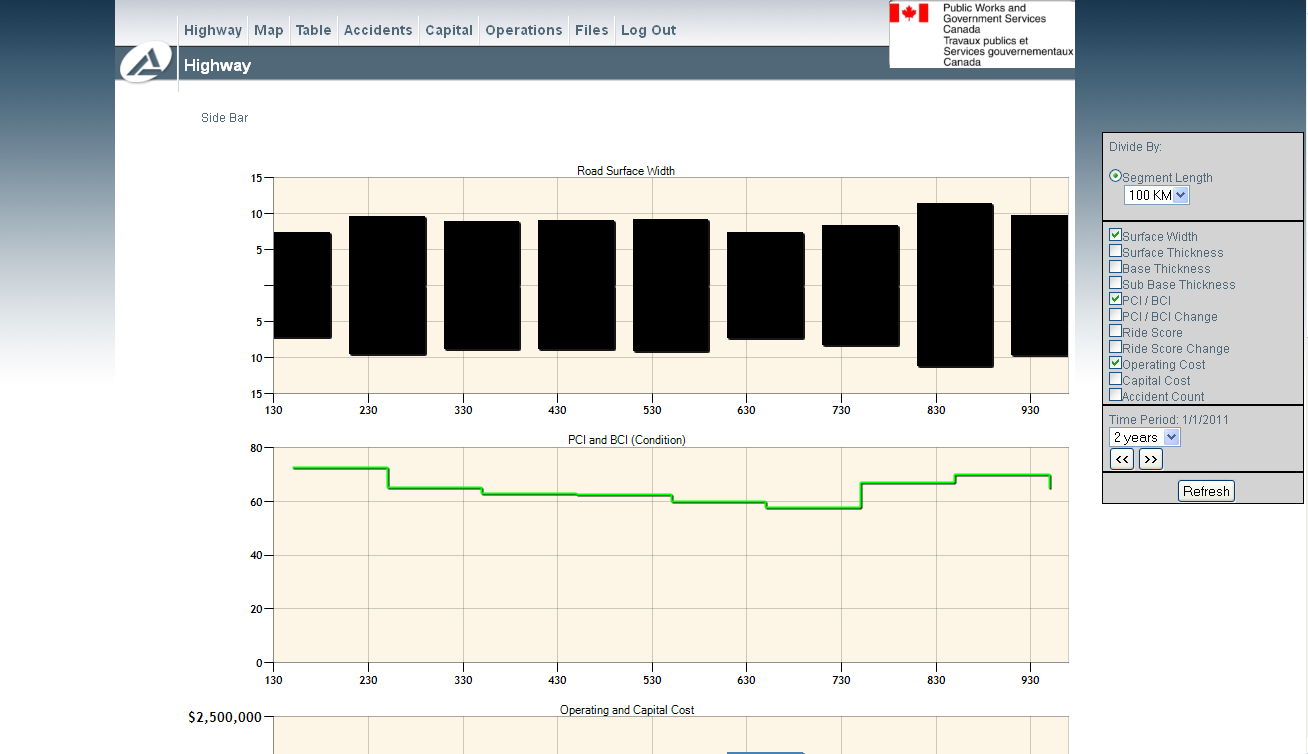
You can customize the highway view with the side bar. If the sidebar is not visible you can access the side bar by clicking on ‘Side Bar’ at the top left hand corner of the screen. If at any point you would like to hide the side bar, click on ‘Side Bar’ again. Graphs can be made visible or invisible by clicking on the corresponding check boxes. Once the customization choices have been made, click on the ‘Refresh’ button to apply the customization.
With the sidebar you can choose the segment length of the charts using the dropdown and the from and to location (in km with one (1) decimal place). You can also choose the time period with the appropriate drop down and use the forward and back buttons to change the current timeframe. The size of the charts can be changed with the width and height textboxes at the bottom of the sidebar. The width and height are in pixels.
Some of the charts have additional options. These include filters, themes and trend lines. These can be applied by clicking the corresponding buttons and/or checkboxes next to the chart names.