Financial Chart
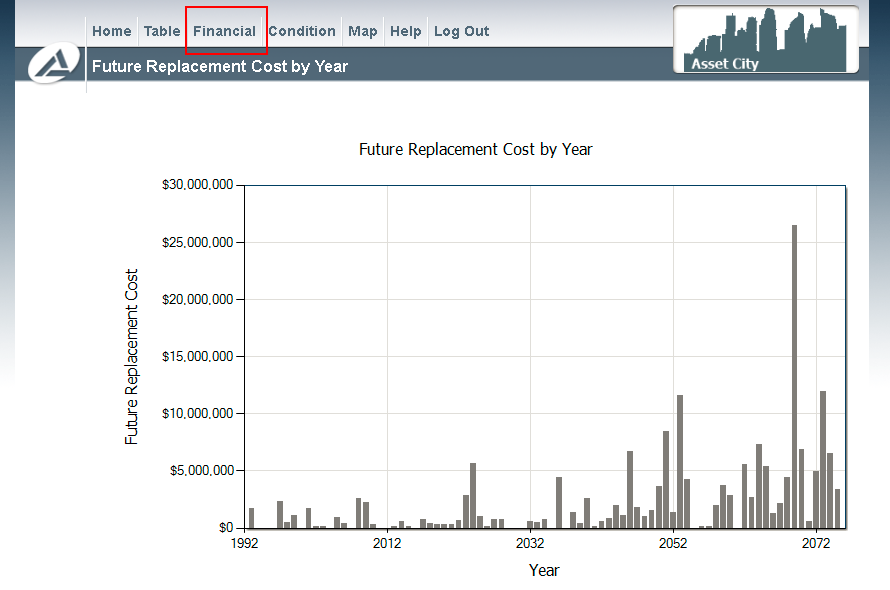
The financial screen provides a view to the future and past spending profiles of the asset inventory based on the recorded expected useful lives. Clicking on any of the bars will take you to the table view showing the list of assets represented by the bar.
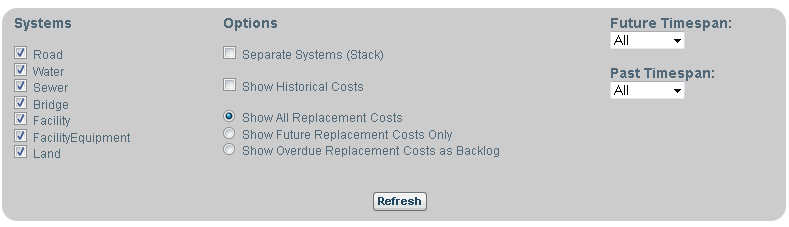
The list under the “Systems” header in the picture above allows the user to limit which asset systems or classes are being displayed in the chart.
There are also numerous options available on the financial screen, under the “Options” header in the picture above.
Separate Systems will change the chart to be a stacked column chart with each system separated.
Show historical costs will include the past spending profile based on historical cost and original construction/purchase date.
Show All Replacement Costs will display all replacement costs as future costs regardless if they have occurred in the past (and are now considered backlog).
Show Future Replacement Costs only will eliminate backlog costs from the chart.
Show Overdue Replacement Costs as Backlog will aggregate overdue costs and display them as a single bar in the current year.
Future Timespan allows the user to limit the chart to a desired number of years into the future.
Past Timespan allows the user to limit the chart to a desired number of years into the past.