Asset Table
To view the Asset table, click on the ‘Table’ tab located at the top of the screen. The table screen presents a tabular view of the asset infrastructure. It allows for the comparative analysis on an asset class or asset “system” basis. The link to this view can also be emailed or bookmarked.
Options
If at any point you cannot see a column that you would like to see, click on the ‘options’ button at the top left of the table (shown in the above image). This will open a dialog box (shown above) which allows the user to select specific columns for viewing. Columns can be chosen and added individually by clicking on the drop down menu, choosing the desired column name and clicking the ‘add’ button. Once the column is chosen, it will appear in the list of columns in the table view with a red ‘X’ beside it, as shown below.
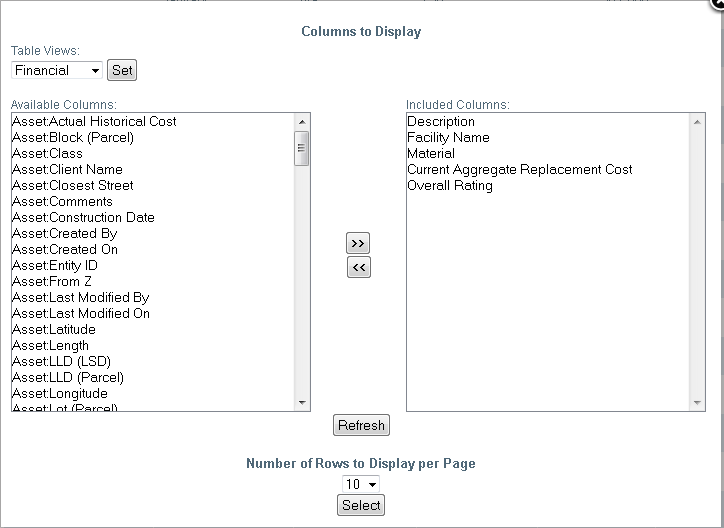
To return to table view, click on the ‘Update’ button below the list of columns. In order to increase or decrease the number of records per page, click on the ‘Number of items’ drop-down menu, select a number and click on the ‘Select’ button. The ‘Reset’ button located beside the ‘Update’ button in the dialog box will clear any columns that have been added to the table view by the user.
Searching, Filtering and Sorting
In table view, data can be searched and filtered by clicking on ‘Advanced Search’ tool located at the top left hand corner of the table view. When using filters, only data that you want to view is visible. This data can be updated to be viewed as geometry on the map or exported to an excel workbook.
To apply filters, click the filter button next to the column header of the column you wish to filter.

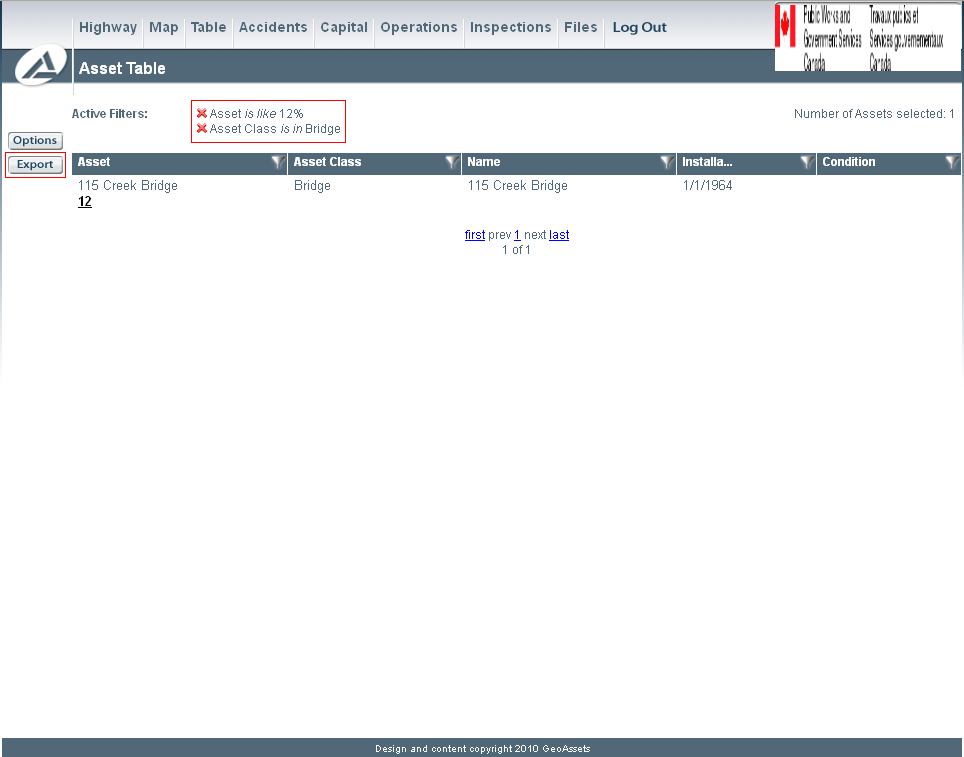
Multiple filters can be applied within the table. After filtering one column, click the filter button of another column. Follow the same procedure as with the previous filter. Once all desired filters are applied to the table, the criteria of the filters will appear at the top of the table as “Active Filters” (pictured below).
Exporting
To export the filter to an excel workbook, click on the ‘export’ button at the top left of the table. You can also export the entire table to an excel workbook without filtering, by clicking on the ‘export’ button. In addition, you can use the advanced search butotn to apply multiple filters at once.
To update the map with the selection filter, click on the ‘Map’ table in the main toolbar at the top of the website.
If at any point you wish to clear one or more filter, simply click on the red ‘X’ beside of the column name and filtering criteria which is located at the top of the table under ‘Active Filters’. Any filters made to the table will remain until they are cleared, regardless of navigation to another page of the site.
To sort the table according to a particular column, click on the desired column header.
Pop-up Map Feature
In certain instances, it is useful to see an image of a particular asset in question. This can be done while in the table view by hovering the mouse over an entity ID in the ‘Asset’ column. This will open a map window that will be zoomed into the asset.